A yield curve is a graph that plots the relationship between interest rates and the time to maturity for fixed-income securities with equal credit quality. The shape of a yield curve can be analyzed to forecast future interest rates and economic activity.
The most frequently reported yield curve compares U.S. Treasury debt, such as the three-month, two-year, five-year, 10 year and 30 year. This curve is used as a benchmark for other debt in the market such as mortgage rates and bank lending rates.
There are three main types of yield curves:
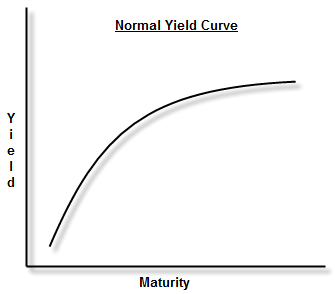
Normal Yield Curve: Due to the risk associated with holding bonds for longer periods of time, longer maturity bonds often have a higher yield than shorter maturity bonds. Historically, the gap between short-term and long-term rates is about three percentage points (300 basis points), but may be larger or smaller at any given time. This is the most common yield curve shape and occurs in times of expansion, predicting interest rates will rise in the future.
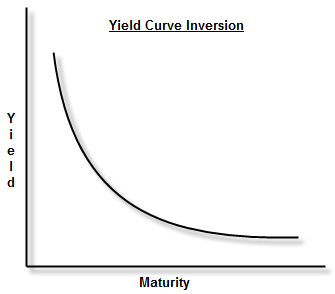
Inverted Yield Curve: When short-term yields are higher than long-term yields (and long-term interest rates are lower than short-term interest rates), the yield curve is considered inverted, or declining. This can indicate interest rates will fall in the future and predict an upcoming recession. Often inverted yield curves arise when the Federal Reserve Board tightens credit in an overheating economy.
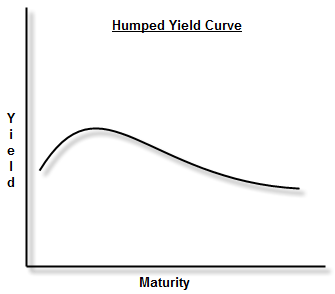
Humped Yield Curve: Shorter and longer-term yield rates are lower than medium-term rates. Humped yield curves are a sign of economic transition, and could indicate slowed economic growth.
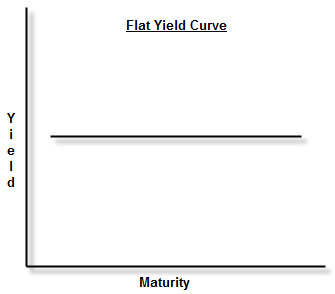
Flat Yield Curve: Flat yield curves exist when shorter and longer-term yield rates are very close to one another. Generally, a flat curve is temporary in nature and indicates uncertainty in the market place as to what direction the fed will take. In a flat environment investors tend to purchase shorter-term securities as they are not compensated to buy long dated maturities.
Knopman Notes
Candidates should be familiar with these different types of yield curves, as they make important predictions about the future of interest rates and economic trends. This includes both familiarity with the names and types of yield curves as well as their interpretations. For example, the steeper the slope of the yield curve, the wider the gaps between short and long-term rates.
Relevant Exams
Series 7, Series 65, Series 66, Series 79, Series 86
Written by Dave Meshkov
Dave's mission (and job: Managing Director of Course Design) is to make FINRA exam training engaging, approachable, and dare he even say, enjoyable. Having trained and coached over ten thousand students to exam success he knows how to present complex subjects in memorable and understandable ways. Prior to joining Knopman Marks in 2011, Dave practiced bankruptcy law at Weil, Gotshal & Manages and served as a law clerk in a the Southern District of New York Bankruptcy Court working on the General Motors and Lehman Brothers bankruptcies. Building on his legal expertise and training allows him to keep all our courses updated with the latest legislative and rule-making changes. Dave currently trains for the Securities Industry Essentials (SIE) exam and the Top-Off Series 6, 7, 24, 57, 63, 65, 66, 79, 86, 87, and 99 exams. He also delivers executive one-on-one training and shares his passion for learning outside of work as a ski instructor and yoga teacher. Dave graduated magna cum laude from Fordham Law School, and cum laude with a BA from the University of Pennsylvania.
Related posts
 Read more
Crush the SIE Exam with the Video Vault
Are you feeling overwhelmed by the sheer volume of Securities Industry Essentials (SIE) exam cont
 Read more
Master the Series 63 Exam with the Video Vault
Are you feeling overwhelmed by the dense text of Series 63 exam prep? Do you consider yourself mo
 Read more
How To Pass the Series 7 Exam in 2025
You’ve already passed your SIE and you’re ready for the next step – the Series 7 exam. The Series